Report Constructor
Report Constructor
1. Purpose
The Report Constructor is designed for creating and configuring reports for monitored units. It allows users to build a report template for a specific task, such as monitoring trips, stops, fuel, engine hours, geofence visits, speeding events, and other unit-related activities.
The same template can be used for both a single unit and a group of units. Once configured, the template is saved, so users do not need to select tables, columns, groupings, and other parameters again each time they generate the same type of report.
2. Main Features
The Report Constructor allows users to:
- create report templates;
- add tables, statistics, and charts to a report;
- select the required columns in tables;
- rename indicators and tables;
- configure the order in which data is displayed;
- group data by date, unit, shift, day of the week, and other parameters;
- enable details, row numbering, and totals;
- use filters for specific table types;
- view generated reports online;
- export reports to PDF, XLSX, and CSV;
- use templates for regular report generation.
3. Report Components
A report can include several components.
| Component | Purpose |
|---|---|
| Statistics | Shows general report information and summary indicators for the selected period. |
| Tables | The main part of the report. Tables show trips, stops, fuel fillings, fuel drains, engine hours, geofences, and other data. |
| Charts | Used for visual analysis of indicators such as speed, fuel, temperature, voltage, engine RPM, and other values. |
| Export | Allows users to save the report as a file or use it outside the system. |
4. Report Template
A report template is a saved report structure with all selected settings.
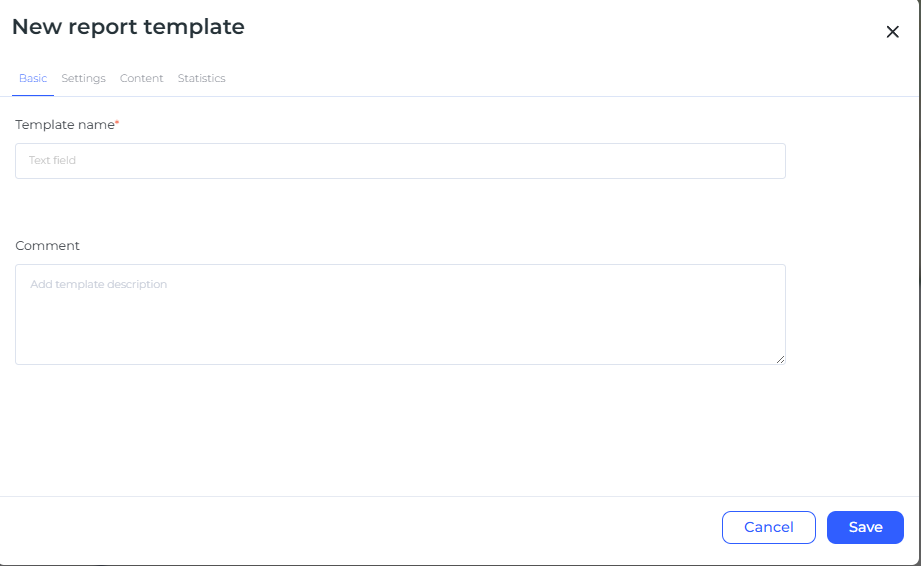
A template can include:
- report name;
- table set;
- statistics set;
- chart list;
- selected columns;
- data display order;
- groupings;
- filters;
- additional display parameters.
A template is used to quickly generate recurring reports of the same type. For example, a user can configure a fuel report, trip report, or engine hours report once and then run it for the required period.
5. Statistics
Statistics is a summary block of the report. It shows key data for the selected period.
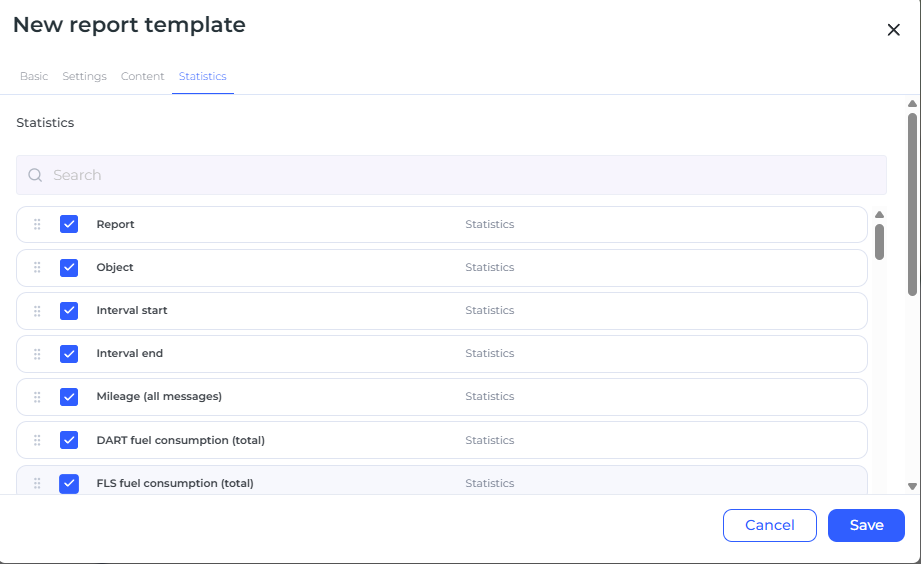
Statistics may include:
- report name;
- unit or unit group;
- start and end of the reporting period;
- mileage;
- engine hours;
- fuel consumption;
- number of trips;
- number of stops;
- number of fuel fillings and fuel drains;
- latest unit data.
For a report generated for a group of units, statistics contains a limited set of general data: report name, unit group, start of the period, and end of the period.
When configuring statistics, users can select the required indicators, change their order, and rename the displayed labels if necessary.
6. Report Tables
Tables are the main part of the report. Each table is responsible for a specific type of data.
The following main tables are available in the constructor:
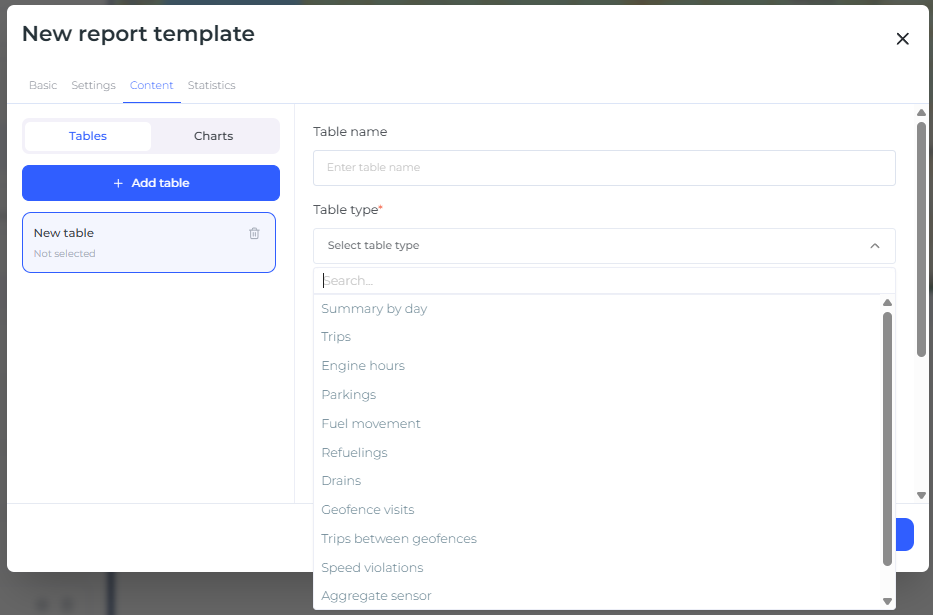
| Table | Purpose |
|---|---|
| Daily Summary | Used to analyze key indicators by day. |
| Trips | Used to analyze unit movement. |
| Engine Hours | Used to monitor engine or equipment operating time. |
| Stops | Used to analyze stops and long idle periods. |
| Fuel Summary | Used for general analysis of consumption, fuel fillings, and fuel level. |
| Fuel Fillings | Used to monitor detected fuel fillings. |
| Fuel Drains | Used to monitor possible fuel drains. |
| Geofences | Used to analyze visits to specified zones. |
| Trips Between Geofences | Used to monitor routes between selected zones. |
| Speeding Events | Used to analyze speed limit violations. |
| Fuel Movement | Used to analyze fuel level changes over a period. |
| Aggregate Sensors | Used to monitor sensors with on/off states. |
| Sensor Tracing | Used to view sensor values at specific points in time. |
For each table, users can select only the columns they need. This helps avoid overloading the report with unnecessary information.
7. Column Configuration
Each table allows users to configure its column set.
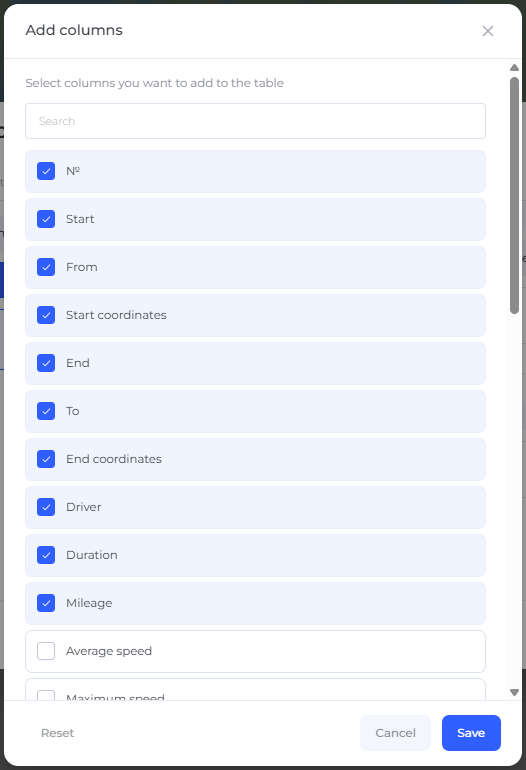
Users can:
- add required columns;
- remove unnecessary columns;
- change the column order;
- rename displayed labels;
- search through available indicators.
The column order in the settings corresponds to the order in which the columns are displayed in the generated report.
8. Data Grouping
Grouping helps structure the report and makes it easier to analyze.
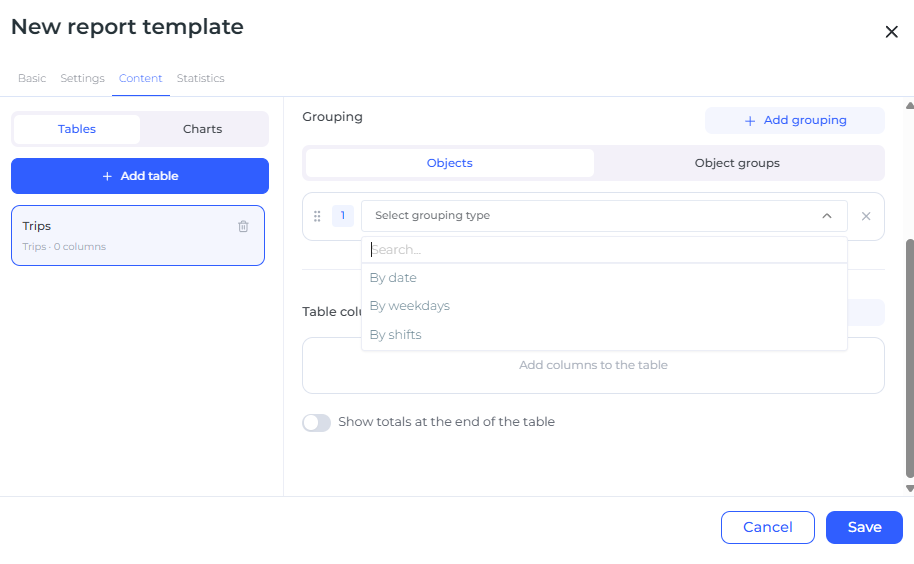
Depending on the report type, data can be grouped by:
- date;
- unit;
- day of the week;
- shift;
- geofence;
- sensor;
- trip direction between geofences.
Different grouping options may be available for reports generated for a single unit and for reports generated for a group of units.
If no grouping is selected, the data is displayed as a single list.
9. Additional Table Parameters
Tables may include additional parameters:
| Parameter | Description |
|---|---|
| Details | Allows users to expand grouped data and view nested rows. |
| Row Numbering | Adds row numbers. When grouping is used, numbering becomes multi-level. |
| Totals | Adds a final row with summary or calculated values. |
The totals row is used only for values that can be calculated: duration, quantity, mileage, consumption, averages, minimum values, or maximum values.
10. Shifts
Shifts are used to analyze data within specified working intervals.
For example, if a shift lasts from 09:00 to 18:00, the report can show data separately within that shift. This is useful for monitoring vehicles, employees, or equipment operating on a shift schedule.
When configuring shifts, users can apply interval extraction. If it is enabled, only the part of an event that falls within the shift is included in the report. If it is disabled, the event is displayed in full and may be assigned to the “Outside shift” group.
11. Filters
Some tables include additional filters.
Examples:
- in the Stops table, users can set minimum and maximum stop duration;
- in the Speeding Events table, users can filter events by violation duration;
- in geofence reports, users can select specific zones;
- in the Trips Between Geofences table, users can specify start and end zones;
- in sensor-related tables, users can specify required sensor names.
Filters help keep only the data that is important for the analysis.
12. Charts
Charts are used for visual data analysis.
A report template can include charts for the following indicators:
- voltage;
- fuel consumption;
- aggregate sensor operation;
- speed;
- temperature;
- engine RPM.
The chart name can be changed.
Charts may display event markers:
- stops;
- speeding events;
- fuel drains;
- fuel fillings.
The chart background can also be configured to show different unit states, such as trips, stops, engine hours, short stops, or connection loss.
13. Sensor Masks
Sensor masks can be used for some charts and tables.
A mask is useful when a unit has several sensors of the same type and the report needs to display data from a specific sensor.
For example, if a unit has several temperature sensors, users can specify the required sensor so that the chart is built based on that exact sensor.
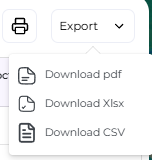
14. Report Export
A generated report can be exported in the following formats:
- PDF;
- XLSX;
- CSV.
The contents of the exported file depend on the template settings. If tables, columns, groupings, or other parameters are changed in the template, these changes must also be reflected in the exported report.
15. When to Use the Report Constructor
The Report Constructor should be used when users need to:
- regularly receive reports based on the same indicators;
- prepare a report for a client or internal control;
- compare the operation of one unit or a group of units;
- monitor fuel, trips, stops, engine hours, or violations;
- configure a report for a specific task without unnecessary data.
16. Recommended Configuration Process
Recommended steps for working with a template:
- Create a new report template.
- Specify a clear name.
- Add the required tables.
- Select the required columns.
- Configure statistics.
- Add groupings if needed.
- Enable details, row numbering, or totals if necessary.
- Add filters for specific tables.
- Add charts if visual analysis is required.
- Save the template and check the result using a test report.
17. Summary
The Report Constructor allows users to create flexible templates for different monitoring tasks. Users define which data should be included in the report, in what order it should be displayed, and how it should be grouped.
The main purpose of the constructor is to reduce manual report configuration and make regular unit analytics more convenient and clear.